How to monitor your Linux machine
If you're in charge of running or maintaining any Linux machines, you probably want some visibility to what's going on. Typically users can SSH onto a machine and run top to get system load, CPU, memory and disk usage, among other things.
But I'm a more graphical kind of person. I'll explore some ways you can monitor your Linux machine, ranging from the easiest (and perhaps least flexible) to the trickier but more customizable.
The simplest
Connect to your machine (probably via SSH/PuTTY) and then run the top command.
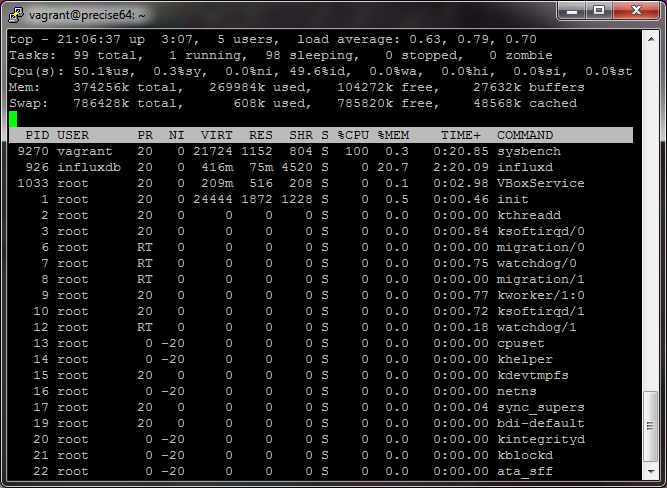
I won't go over everything you can do with this command, since there are plenty of guides out there already. Just note that memory usage may not be super intuitive the first time reading it. See here.
htop
htop is a little fancier, and it's one of the first things I install on a fresh Linux box.
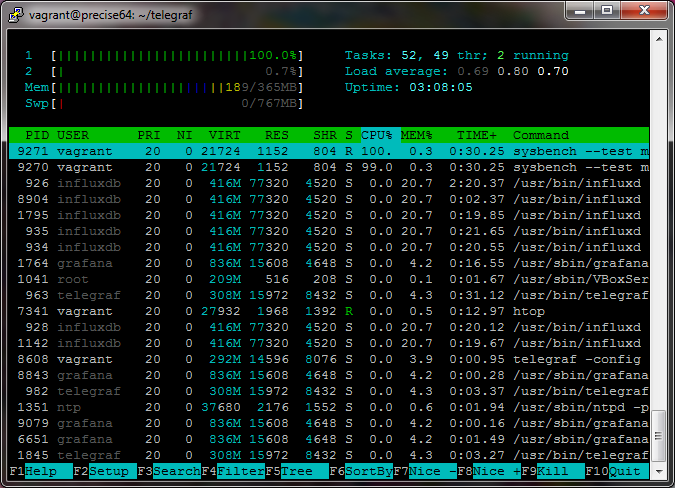
See the htop website.
Simple and graphical, requires install
If you only have a couple machines you want to monitor, and don't mind instally Ruby (or already have it installed) check out Scout Realtime. You can then view the real-time chart with a web browser, which looks like the following
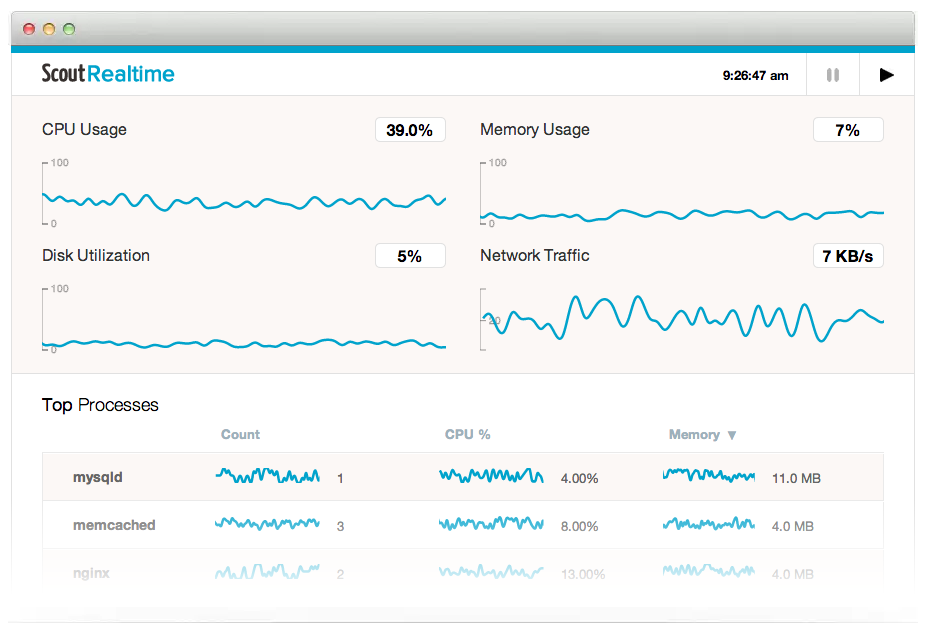
I've used it for awhile and liked it well enough. You may have to set up either some firewall rules or a forwarding proxy like Apache/Nginx if you'd rather not remember which port it's running on. They say the monitoring daemon consumes about 1% on an Intel Xeon 2.40GHz CPU and around 22 MB memory, so fairly lightweight.
Does your cloud provider give you graphs?
I use Amazon AWS for many projects, and their EC2 instances (and some other services, like their database offerings) provide monitoring for free, right out of the box. Here's how I can quickly monitor my EC2 instances from the last hour to the last 3 weeks:
Similarly, here's what Amazon shows about my PostgreSQL database:
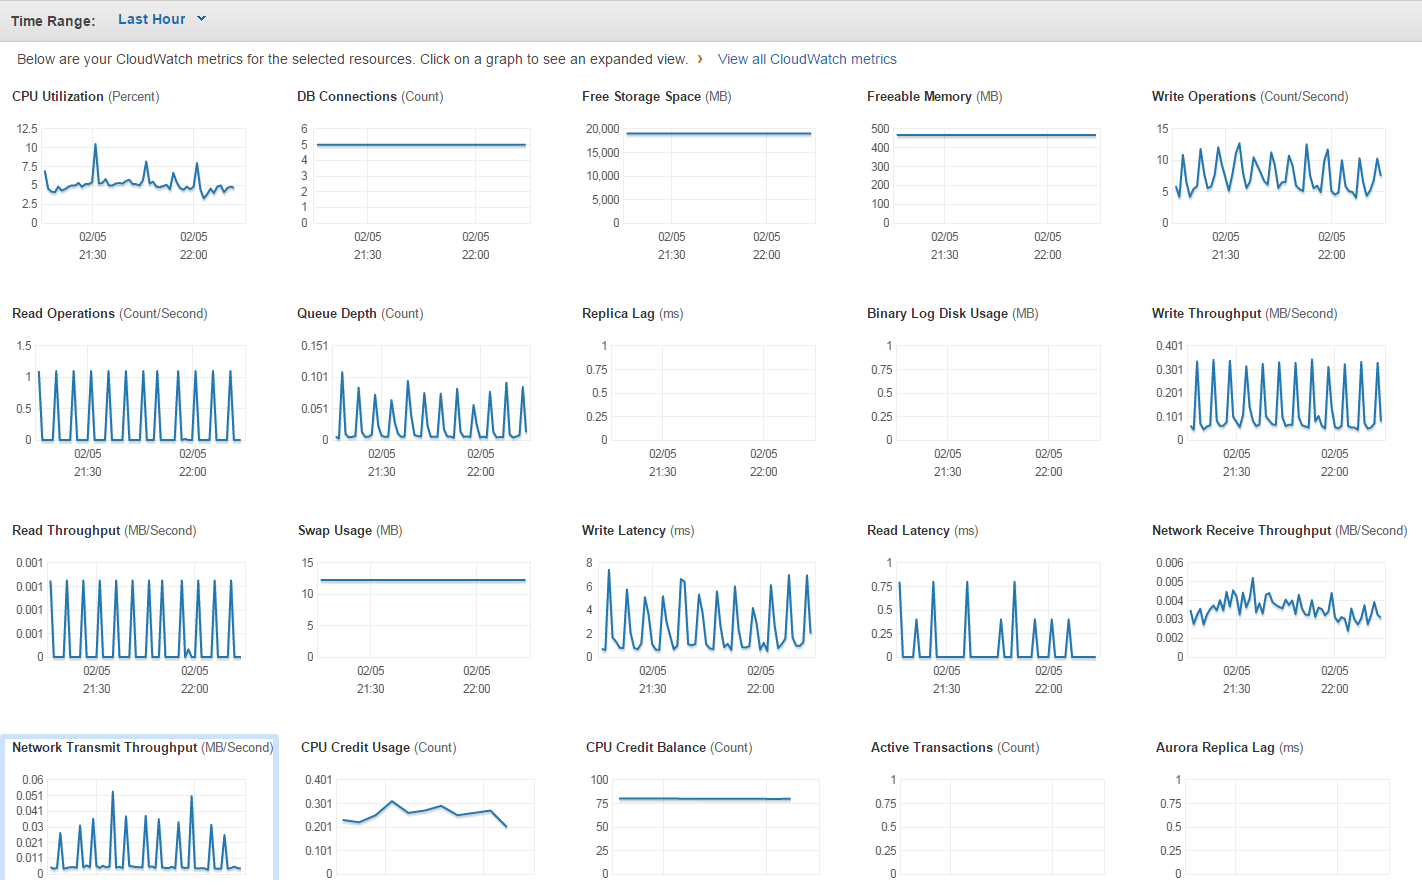
Note that for EC2 monitoring they give you resolution of 5 minutes, and for RDS monitoring they give you a resolution of 1 minute. I believe you can pay to have higher resolution monitoring.
If I had to guess, Google's and Microsoft's cloud offerings probably provide monitoring, and perhaps Digital Ocean or Linode.
Buy your monitoring
If you have more money than time, there are lots of companies that will happily sell you pretty, realtime charts of your systems. Some that come to mind are Scout
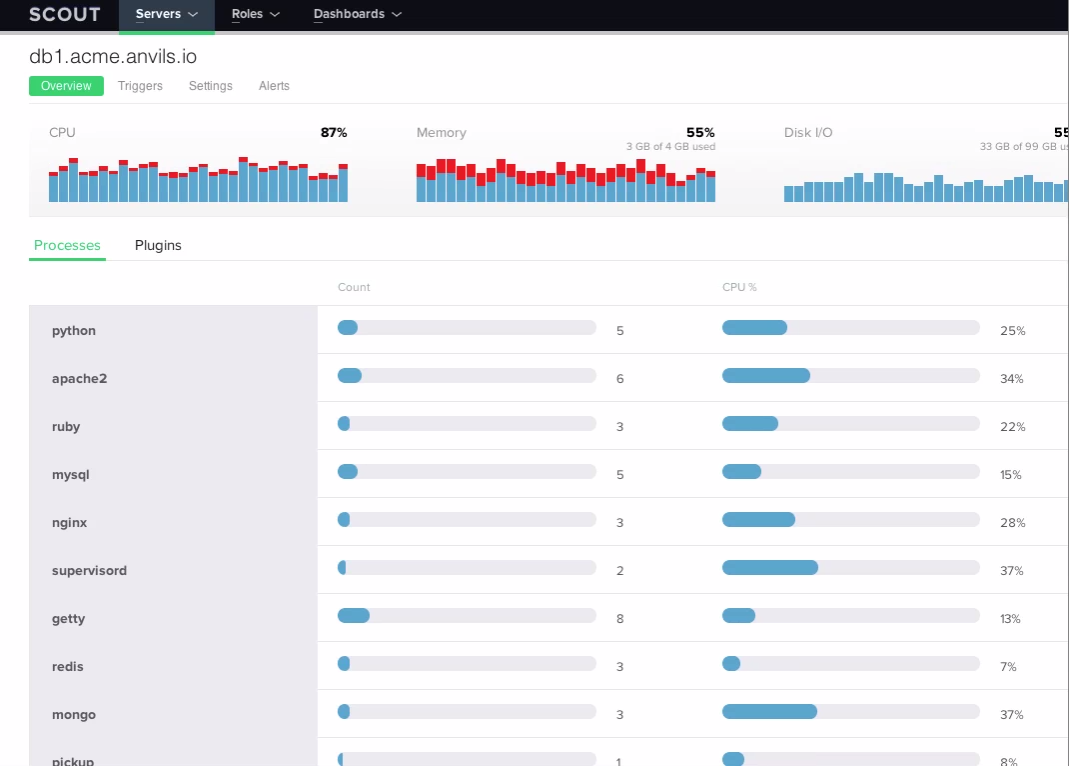
and New Relic shown below
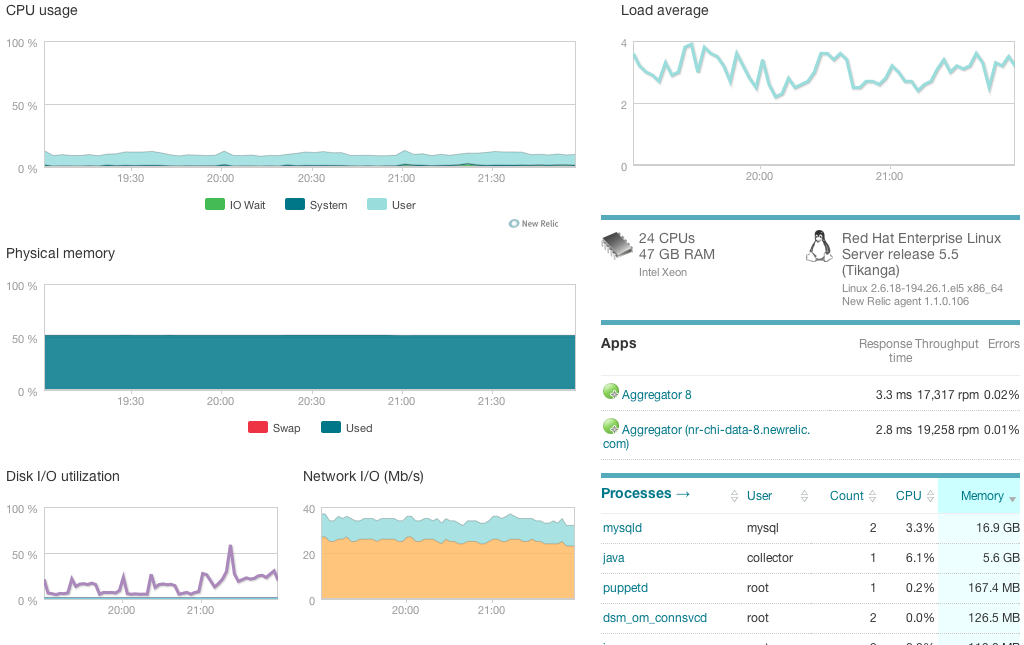
There's also Datadog, Sensu, and Nagios that you can check out.
Make your own graphs
But for my hobby projects I have more time than money, so I opt for the DIY approach. It's also more fun.
My preferred monitoring stack looks like the following:
- InfluxDB for ingesting and storing data
- Grafana for displaying real-time and historical charts
- Telegraf for system monitoring
Note that many people used Graphite and CollectD happily in the past. Grafana is a rich web application (built with AngularJS) that is a sort of a successor to Graphite, since development for Graphite seems to have stalled. From my research, CollectD seems to be a very suitable (and widely used) daemon which collects system performance statistics periodically, but needs some slight configuration to work with InfluxDB. Because Telegraf is maintained by the same people who wrote InfluxDB, and because it has a large GitHub presence, I decided to go with Telegraf.
The way that I monitor my servers is to install InfluxDB and Grafana on one machine, and then install Telegraf on every machine that I want to monitor.
Installing InfluxDB
Installing on an Ubuntu machine is straightforward. Per the downloads page:
$ wget https://s3.amazonaws.com/influxdb/influxdb_0.10.0-1_amd64.deb
$ sudo dpkg -i influxdb_0.10.0-1_amd64.deb
$ sudo service influxdb start
Starting the process influxdb [ OK ]
influxdb process was started [ OK ]
$ influx
Connected to http://localhost:8086 version 0.10.0
InfluxDB shell 0.10.0
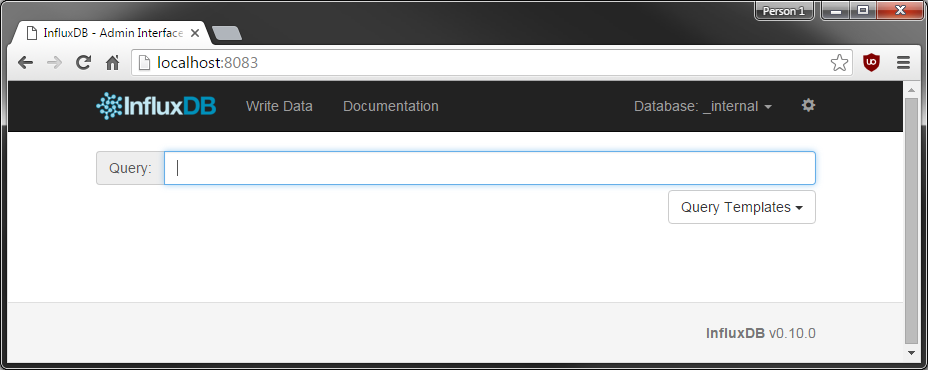
You can also visit the web interface that (by default) runs on port 8083:
Installing Grafana
Also simple enough. Per the downloads page:
$ wget https://grafanarel.s3.amazonaws.com/builds/grafana_2.6.0_amd64.deb
$ sudo apt-get update
$ sudo apt-get install -y adduser libfontconfig
$ sudo dpkg -i grafana_2.6.0_amd64.deb
$ sudo service grafana-server start
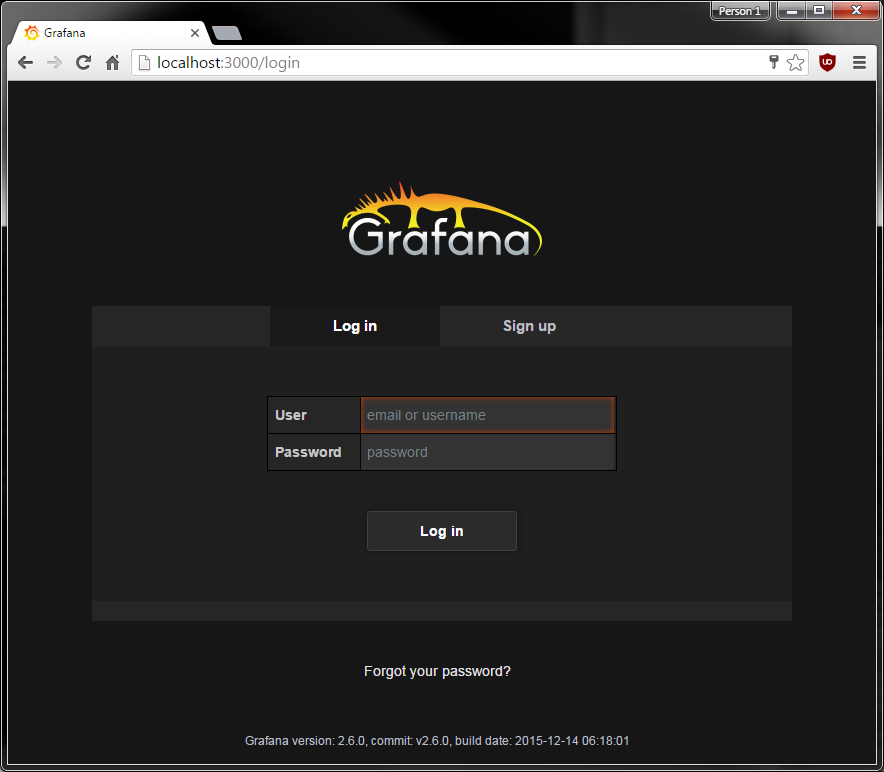
You can also visit the web interface that (by default) runs on port 3000:
Installing Telegraf
Per the GitHub page:
$ wget http://get.influxdb.org/telegraf/telegraf_0.10.2-1_amd64.deb
$ sudo dpkg -i telegraf_0.10.2-1_amd64.deb
Next you have to decide what you want to monitor. Running the following command will generate a sample config file listing many inputs and outputs. You can view the resulting telegraf.conf file if you wish.
$ telegraf -sample-config > telegraf.conf
For demonstration purposes, I want to monitor CPU, memory, and swap usage and output it to InfluxDB. Therefore I can generate the configuration file by specifying:
$ telegraf -sample-config -input-filter cpu:mem:swap -output-filter influxdb > telegraf.conf
And then run telegraf by passing in the configuration file:
$ telegraf -config telegraf.conf
2016/02/10 01:05:19 Starting Telegraf (version 0.10.2)
2016/02/10 01:05:19 Loaded outputs: influxdb
2016/02/10 01:05:19 Loaded inputs: cpu mem swap
2016/02/10 01:05:19 Tags enabled: host=precise64
2016/02/10 01:05:19 Agent Config: Interval:10s, Debug:false, Quiet:false, Hostname:"precise64", Flush Interval:10s
2016/02/10 01:05:20 Gathered metrics, (10s interval), from 3 inputs in 752.027µs
2016/02/10 01:05:30 Gathered metrics, (10s interval), from 3 inputs in 1.537643ms
2016/02/10 01:05:30 Wrote 7 metrics to output influxdb in 7.466383ms
View the stats
Head over to Grafana at localhost:3000 in a web browser. The default password/username is admin/admin. Click on Data Sources > Add new since we'll tell Grafana about InfluxDB, as shown in the screenshot below.
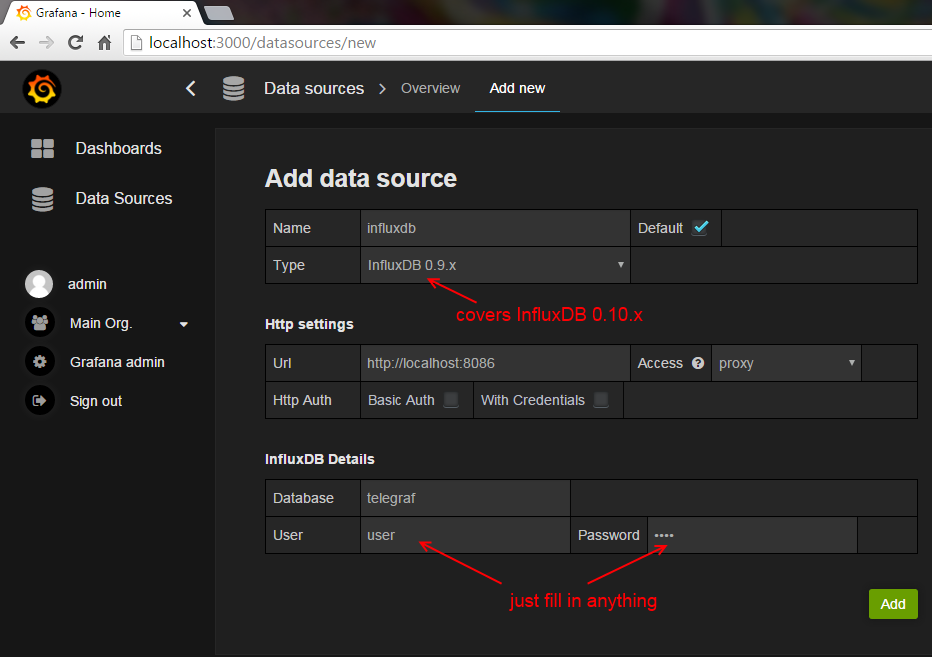
Grafana requires a database user/name to complete the form, but InfluxDB doesn't actually care.
You can create some dashboards be selecting the fields you want to query, and then organize everything as desired. I spent about ten minutes setting mine up.
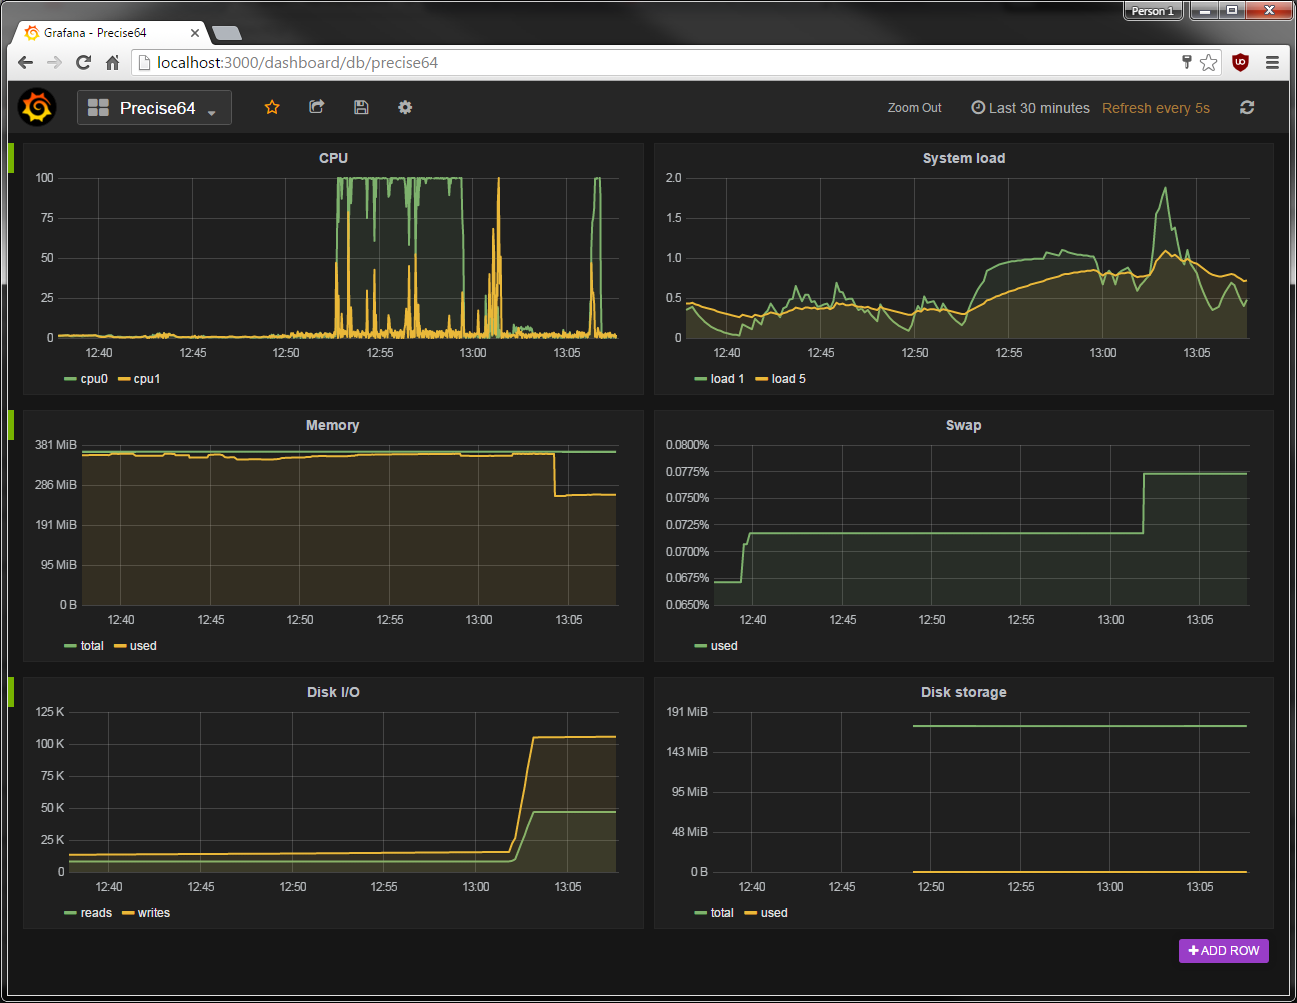
I also ran some tests so the charts would fluctuate a little
$ sudo apt-get install sysbench
$ sysbench --test=cpu --cpu-max-prime=40000 run
$ sysbench --test=memory --memory-total-size=8G run
$ sysbench --test=fileio --file-total-size=8G prepare
$ sysbench --test=fileio --file-total-size=8G --file-test-mode=rndrw --max-time=60 --max-requests=0 run
$ sysbench --test=fileio --file-total-size=8G cleanup
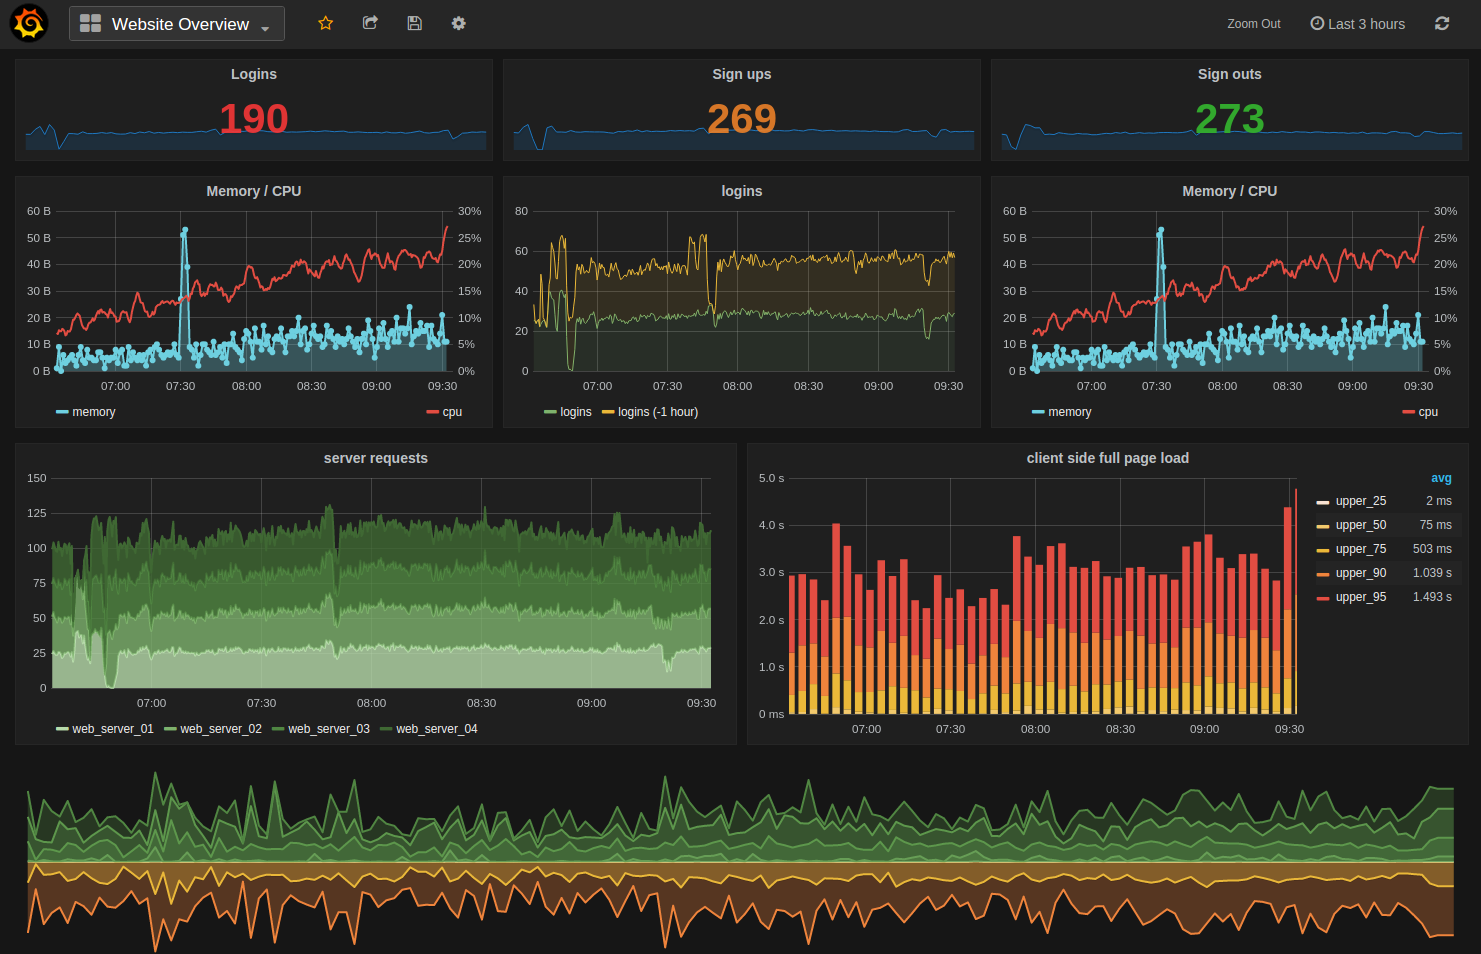
If you spend more time with Grafana you can make very pretty, and very useful charts. Here's an example from the Grafana website:
Other telegraf inputs
There's a whole list of plugin inputs that you can set up to monitor all sorts of things like Apache connections, reqs/sec, busy/idle workers. Or PostgreSQL transactions, rollbacks, inserts, updates. Or redis connected clients, used memory, rdb changes since last save, expired or evicted keys. Or a procstat plugin to monitor system resource usage by individual processes. You can modify existing ones or write your own.
I'll go over configuring the procstat plugin since I wanted to use it:
$ telegraf -sample-config -input-filter procstat -output-filter influxdb > procstat.conf
$ vim/nano procstat.conf
Edit the file under inputs to add:
# Monitor process cpu and memory usage
[[inputs.procstat]]
  # Must specify one of: pid_file, exe, or pattern
  # PID file to monitor process
  # pid_file = "/var/run/nginx.pid"
  # executable name (ie, pgrep <exe>)
  # exe = "nginx"
  # pattern as argument for pgrep (ie, pgrep -f <pattern>)
  # pattern = "nginx"
  exe = "grafana"
  # Field name prefix
  prefix = "grafana"

[[inputs.procstat]]
  exe = "telegraf"
  prefix = "telegraf"

[[inputs.procstat]]
  exe = "sysbench"
  prefix = "sysbench"
Then run it with the following:
$ telegraf -config procstat.conf
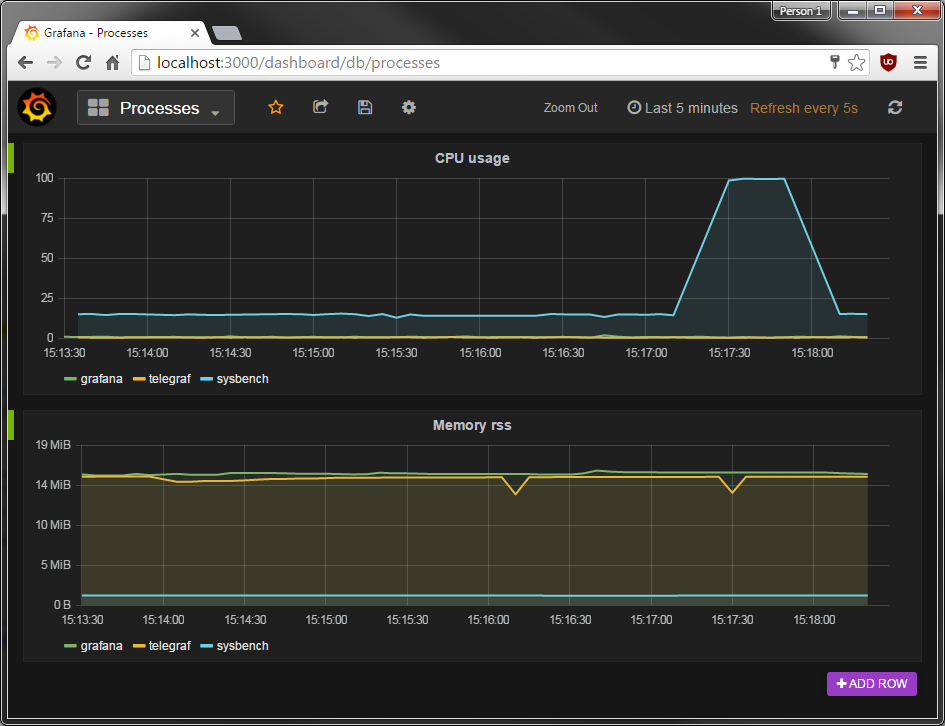
After defining what to query in Grafana, you can expect to see graphs like the following
Limitations
I wanted to create charts just like the Scout Realtime report. But there wasn't an obvious way to get CPU usage as a percentage from Telegraf. It does provide % idle as well as the load, so I guess there's that.
Instead of specifying each PID or process name for procstat in the Telegraf config file, I'd rather it be smart enough to just collect all of the processes running and report on them with easy tag names. That way I could show the "top processes" by CPU usage or memory usage.
Furthermore, I found it difficult to get memory usage for each process. I did some brief research, but couldn't figure out exactly what procstat_memory_rss, procstat_memory_vms, and procstat_memory_swap actually meant.
An InfluxDB tip
Once you're done playing with InfluxDB and want to use it long term, you may want to set up retention policies. The easiest thing to do is to have InfluxDB only keep your data for X days or Y months. Other tricks that you can do are downsampling or aggregation. From the example in the docs:
We have real-time data that track the number of food orders to a restaurant via phone and via website at 10 second intervals. In the long run, we’re only interested in the average number of orders by phone and by website at 30 minute intervals.
You'd set up the following rules in InfluxDB:
- automatically delete the raw 10 second level data that are older than two hours
- automatically aggregate the 10 second level data to 30 minute level data
- keep the 30 minute level data forever
To keep things simple, and for my needs, I just have InfluxDB throw away data that's older than a three days. I specify the retention policy when I create the database:
> CREATE DATABASE telegraf WITH DURATION 3d
Further avenues to explore
It's worth mentioning how easy it is to throw data at InfluxDB. It has an HTTP endpoint so you can just POST data to it, from a shell command or within an application. Whenever I'm developing web apps and ask myself, "How often does X occur?" I just write a line of code to POST to InfluxDB some data so I can monitor it. It becomes as easy as adding a console.log() statement or System.out.println().
I didn't go over Prometheus monitoring, which sort of looks like it tries to do everything - data ingestion, storage, querying, visualizations, and alerting. But it's worth mentioning here.
CollectD can be used instead of Telegraf. It's a daemon which collects system performance statistics periodically. CollectD needs a little work to get it to send data to InfluxDB. From a bit of research, people seem to prefer Telegraf over CollectD since it's newer and works out of the box with InfluxDB.
Munin is worth checking out. One user described it as "still really frankly one of the absolute best free, open source, lightweight ways to get monitoring on Linux systems, and also benefits from being very easily scriptable and not having outrageous runtime dependencies, and being a very mature code base".
Graphite deserves a mention, just because it was widely used back in the day. Grafana can be thought of as Graphite's successor.
InfluxDB used to be a stand-alone project, but the company turned into InfluxData some time around December 2015. Since then they created three other projects: Telegraf, Chronograf, and Kapacitor. I believe they wanted to create an entire stack of software, of which only some is currently open sourced, and charge companies for support.
Chronograf (from InfluxData) creates an awkward situation, since it looks to be in direct competition to Grafana. They both provide a way to visualize, graph, and create charts/dashboards of time-series data from InfluxDB. Chronograf is not open source, despite a GitHub logo (and a link that takes you nowhere) on their page. Personally I would stay far away from Chronograf and use Grafana instead, but you may want to check it out. I spent some time using it as well as reading over the documentation, and as of right now, I saw no reason to use it over Grafana. As a technical aside, Chronograf uses React and Dygraphs whereas Grafana uses Angular and Flot. I hope there isn't a conflict of interest, such as new features of InfluxDB only working with Chronograf and not Grafana. We'll see what happens in 2016 and beyond.
Some other bloggers wrote about analyzing system metricsw ith InfluxDB/Grafana. One blogger also has the same stack as I walked through. There's also a run down of Graphite, StatsD, and CollectD for a historical perspective.
Enjoy monitoring your machines!