Installing InfluxDB and Grafana on an EC2 instance
I recently set up InfluxDB 0.9.0 (to collect time series data) and Grafana 2.0 (to monitor and benchmark that data) on a t2.micro Amazon EC2 instance running Ubuntu 14.04.2.
Update on 2/7/16: If you want to upgrade or run the latest versions, I detailed my update steps which turned out to be pretty painless.
Installing InfluxDB and inserting values
Head over to the installation page for InfluxDB page to grab the latest binary and install it.
$ wget http://influxdb.s3.amazonaws.com/influxdb_0.9.0_amd64.deb
$ sudo dpkg -i influxdb_0.9.0_amd64.deb
$ sudo /etc/init.d/influxdb start
I then inserted a few values by running these commands running the influx command line interface.
$ /opt/influxdb/influx
Connected to http://localhost:8086 version 0.9.0
InfluxDB shell 0.9.0

> CREATE DATABASE demodb
> SHOW DATABASES
name: databases
---------------
name
demodb

> USE demodb
> INSERT cpu,host=serverA,region=us_west value=0.64
> INSERT cpu,host=serverA,region=us_west value=0.77
Grafana has a few different interfaces to read and write data. I confirmed those values were written by making an HTTP GET request to InfluxDB on port 8086:
$ curl -G 'http://localhost:8086/query' --data-urlencode "db=demodb" --data-urlencode "q=SELECT value FROM cpu WHERE region='us_west'"

$ {"results":[{"series":[{"name":"cpu","columns":["time","value"],"values":[["2015-06-24T19:36:08.520887257Z",0.64],["2015-06-24T19:43:30.336311129Z",0.77]]}]}]}
Installing Grafana and exposing it to the web
Then head over to the installation page for Grafana and install the binary:
$ wget https://grafanarel.s3.amazonaws.com/builds/grafana_2.0.2_amd64.deb
$ sudo apt-get install -y adduser libfontconfig
$ sudo dpkg -i grafana_2.0.2_amd64.deb
$ sudo service grafana-server start
Then I edited the configuration file:
$ vim /etc/grafana/grafana.ini
Specifically, in the Server section, I replaced the domain. Also take note of the http_port as we'll need to create security rule for our Amazon EC2 instance:
#################################### Server ####################################
[server]
# Protocol (http or https)
;protocol = http

# The ip address to bind to, empty will bind to all interfaces
;http_addr =

# The http port  to use
;http_port = 3000

# The public facing domain name used to access grafana from a browser
;domain = grafana.catswithwine.com

# The full public facing url
;root_url = %(protocol)s://%(domain)s:%(http_port)s/
Then restart the Grafana service
$ sudo service grafana-server restart
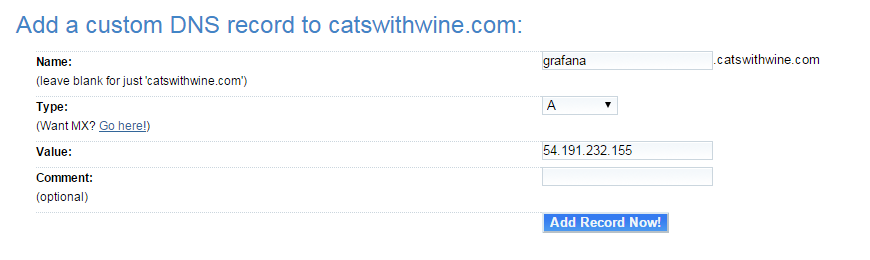
I have my domain registered through Dreamhost, so I went over there next to add the custom DNS record. You'll notice the name is the same domain that I specified in grafana.ini configuration file. The value is the IP address of my Amazon EC2 instance. Note that it can take awhile for these DNS records to propagate around on the internet. It took about 5 minutes before I was able to ping grafana.catswithinwine.com and have it resolve to the IP address.
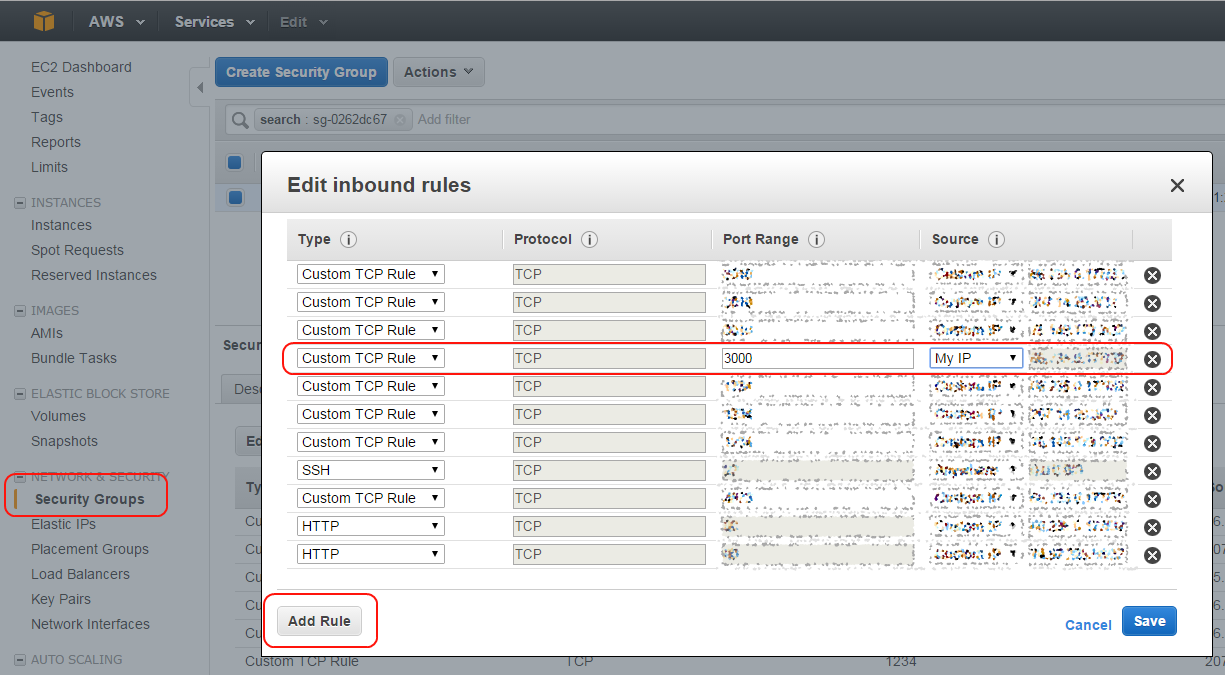
I then went over to my Amazon EC2 instance and created an inbound security rule so I could access Grafana. Note that you can create Security Groups and then apply them to a specific EC2 instance (or a group of EC2 instances). Just make sure you're adding the rule to the EC2 instance you installed Grafana on (in my case, the EC2 instance with the IP address of 54.191.232.155)
Once you've got that all set up, you should be able to access Grafana:
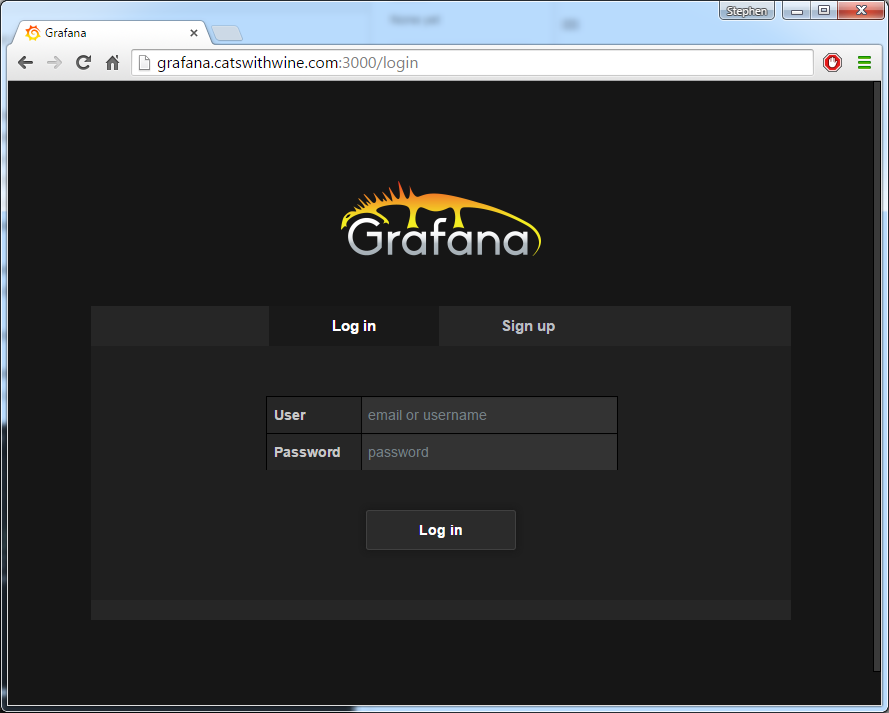
Since I set up the Amazon EC2 security rule to only allow incoming requests from my IP address, this page is accessible only to me. If I try to access it from a different IP address (say, from a cafe, my phone, or a different ISP) I won't be able to reach this page without adding more security rules.
The default username/password is admin/admin.
Configure Grafana to use InfluxDB as a data source
Before we can make any dashboards we'll need to define the data source.
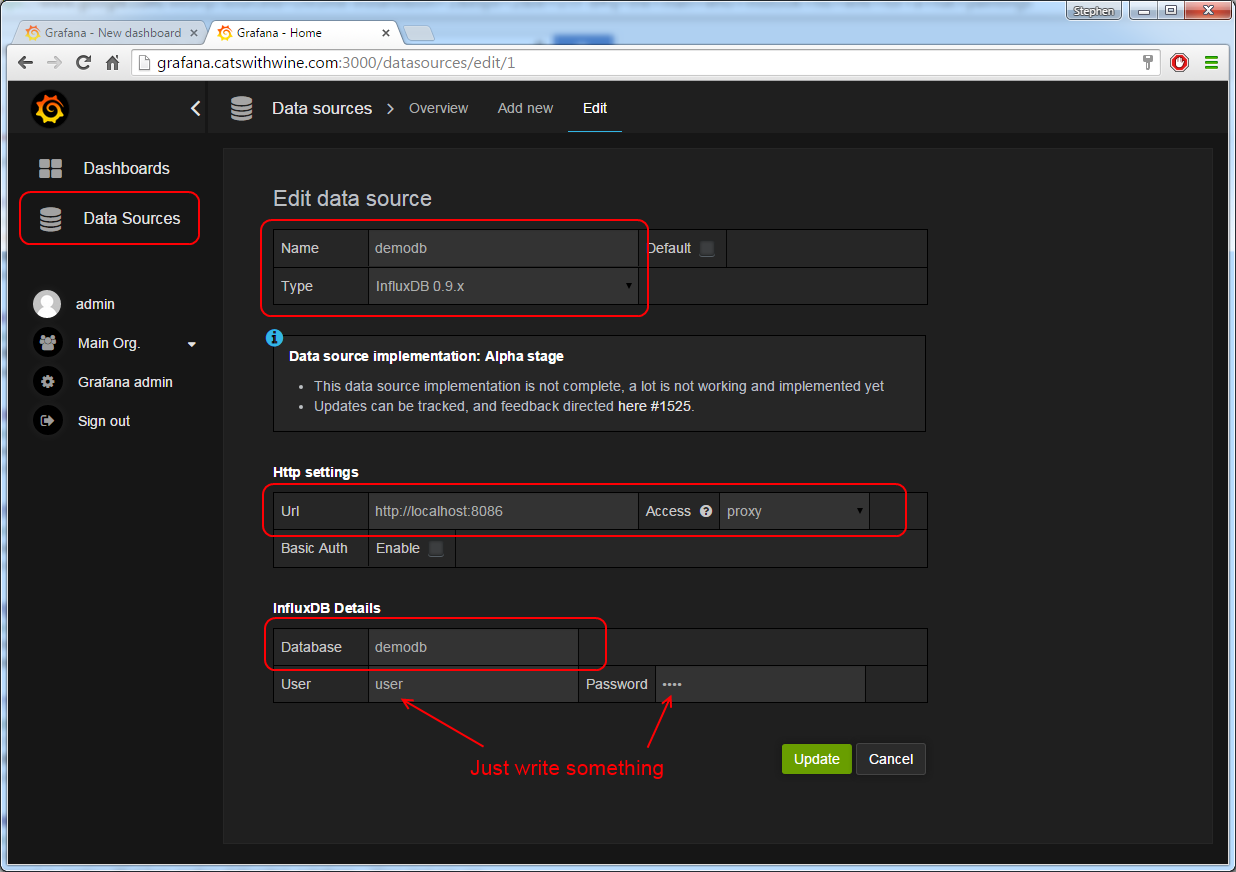
We'll set up Grafana to use the same HTTP protocol on port 8086 that we used to test reading data from InfluxDB. It's important to tell Grafana to proxy the requests, so each request to InfluxDB comes from Grafana and not from your web browser. Remember that we only opened up port 3000 to Grafana in our EC2 security settings. If you don't proxy the requests, you won't be able to reach InfluxDB without changing some security settings or exposing more ports.
It's interesting to note that you must type a user and password to save this data source, even though the default InfluxDB settings don't care about user/passwords unless you explicitly set them up.
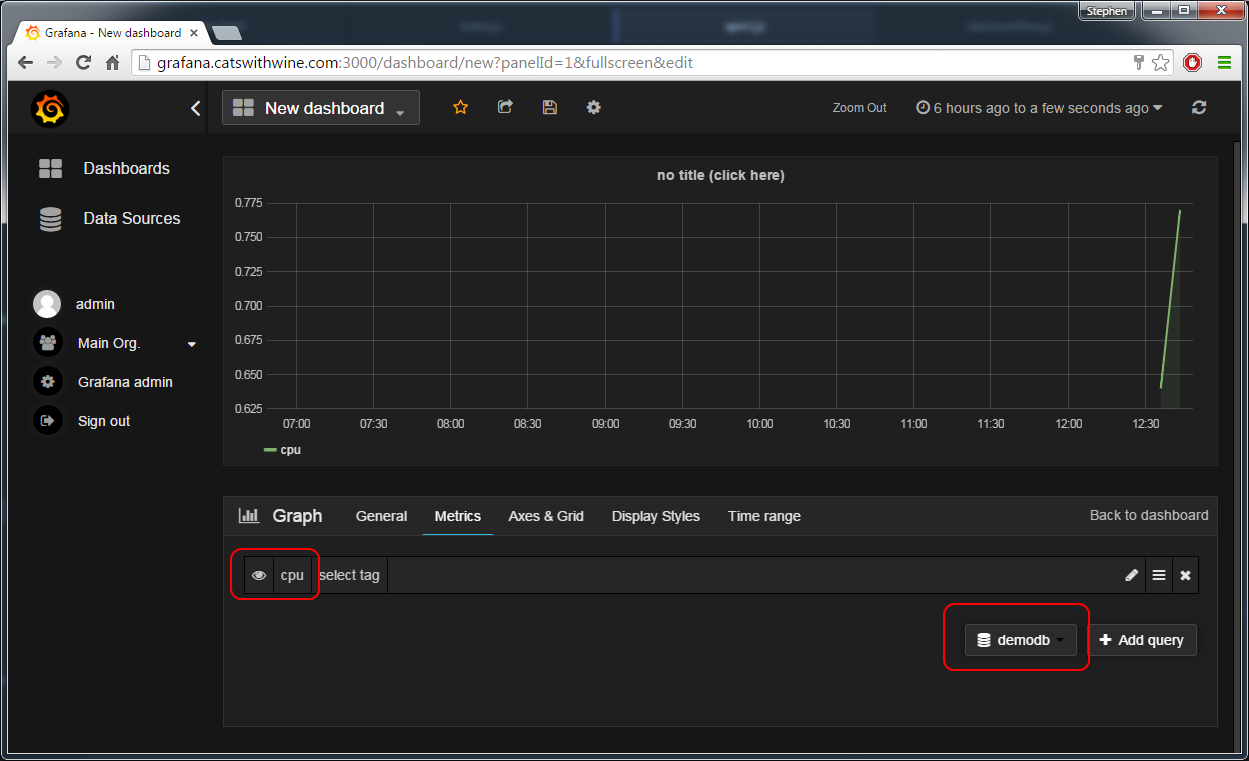
Now go ahead and create your first chart. You should see the two values we inserted earlier.
Next steps
- Install StatsD or Telegraf to start sending data to InfluxDB. Alternatively just
POSTsome data to InfluxDB using the HTTP interface on port 8086 whenever you want to. - Go make some cool charts.
Update on 2/7/16
I upgraded both InfluxDB and Grafana to the latest versions and detailed it here if you're interested.